File:Logit.svg

| Uploaded by | Krishnavedala |
|---|---|
| Upload date | 2021-11-07T16:15:57Z |
| MIME type | image/svg+xml |
| Dimensions | 430 × 280 px |
| File size | 4.2 KB |
Summary
| Description | |
| Date | |
| Source | Own work |
| Author | Krishnavedala |
| SVG development |


Can also be created using python
|
|---|
from numpy import *
from matplotlib.pyplot import *

fig = figure(figsize=(8,5))
ax = fig.add_subplot(111)
ax.grid(b=True,which='major')
ax.minorticks_on()

x = linspace(0.001, 0.999, 100)
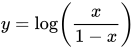
y = log(x / (1.0 - x))

ax.plot(x,y, label=r"$y=\log(\frac{x}{1-x})$")
ax.set_ylabel(r"$y$")
ax.set_xlabel(r"$x$")
ax.legend()
fig.savefig("logit.svg",bbox_inches="tight",\
        pad_inches=.15)
|
Licensing
I, the copyright holder of this work, hereby publish it under the following license:
 
|
This file is made available under the Creative Commons CC0 1.0 Universal Public Domain Dedication. |
| The person who associated a work with this deed has dedicated the work to the public domain by waiving all of their rights to the work worldwide under copyright law, including all related and neighboring rights, to the extent allowed by law. You can copy, modify, distribute and perform the work, even for commercial purposes, all without asking permission.
|