File:Indicator function illustration.png
| Uploaded by | Oleg Alexandrov |
|---|---|
| Upload date | 2007-09-27T01:49:01Z |
| MIME type | image/png |
| Dimensions | 813 × 516 px |
| File size | 19.3 KB |
Summary
| Description |
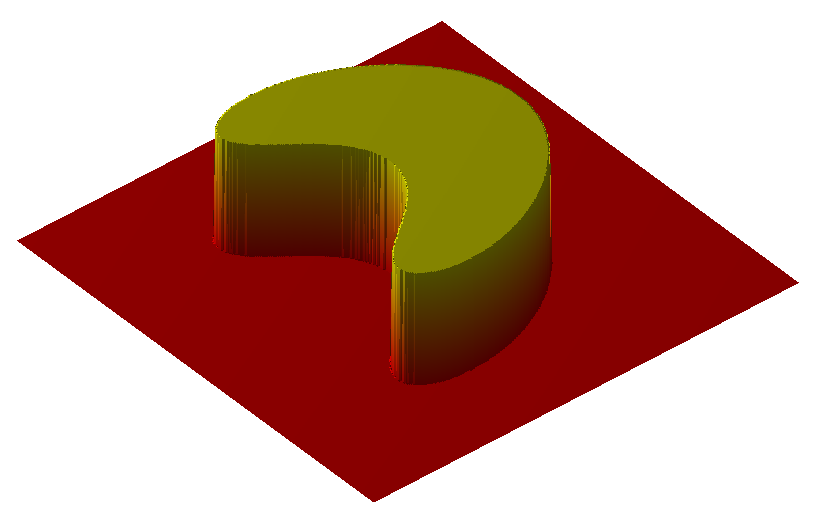
English: Illustration of an Indicator function. |
| Date | (UTC) |
| Source | Own work |
| Author | Oleg Alexandrov |
| PNG development |  This diagram was created with MATLAB. This diagram was created with MATLAB. |
Licensing

|
I, the copyright holder of this work, release this work into the public domain. This applies worldwide. In some countries this may not be legally possible; if so: I grant anyone the right to use this work for any purpose, without any conditions, unless such conditions are required by law. |
Source code (MATLAB)
% illustration of an indicator function in two dimensions
function main()

   % the number of data points. More points means prettier picture.
   N = 400;

   % a function close to what we want, but not smooth
   Z = get_step_function (N);

% plot the surface
   figure(2); clf; hold on; axis equal; axis off;
   scale = 100;
   surf(scale*Z);

% make the surface beautiful
   shading interp;
   colormap autumn;

% add in a source of light
   camlight (-50, 54);

% viewing angle
   view(-40, 38);

   % save as png
   print('-dpng', '-r200', 'Indicator_function_illustration.png');


% get a function which is 1 on a set, and 0 outside of it
function Z = get_step_function(N)
   XX = linspace(-1.5, 4, N);
   YY = linspace(-4, 4, N);
   [X, Y] = meshgrid(XX, YY);

   c = 2;
   k=1.2;
   shift=10;
   Z = (c^2-X.^2-Y.^2).^2 + k*(c-X).^3-shift;

   Z =1-max(sign(Z), 0);

|
This math image could be re-created using vector graphics as a SVG file. This has several advantages; see Commons:Media for cleanup for more information. If a SVG form of this image is available, please upload it and afterwards replace this template with
{{vector version available|new image name}}.It is recommended to name the SVG file “Indicator function illustration.svg”—then the template Vector version available (or Vva) does not need the new image name parameter. |
Category:Files by User:Oleg Alexandrov from en.wikipedia
Category:Images with MATLAB source code
Category:Indicator functions
Category:Math images that should use vector graphics
Category:PD-self
Category:PNG created with MATLAB
Category:PNG that should use vector graphics
Category:Self-published work
Category:Shading interpolation