File:MATLABSChartForPairedXBarAndSChart.png
| Uploaded by | DanielPenfield |
|---|---|
| Upload date | 2013-06-22T14:05:07Z |
| MIME type | image/png |
| Dimensions | 560 × 420 px |
| File size | 3.7 KB |
Summary
| Description |
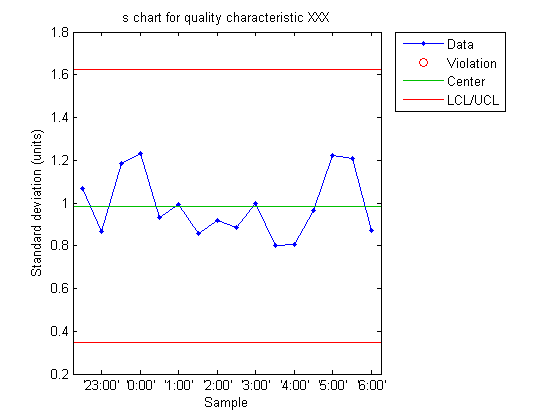
English: A MATLAB-generated s Control chart for a process that experienced a 1.5σ drift starting at midnight. This chart is paired with an xbar chart to form an Xbar and s chart. |
| Date | |
| Source | Own work |
| Author | DanielPenfield |
| PNG development |  This diagram was created with MATLAB. This diagram was created with MATLAB. and with Perl. and with Perl. |

Licensing
DanielPenfield, the copyright holder of this work, hereby publishes it under the following license:


This file is licensed under the Creative Commons Attribution-Share Alike 3.0 Unported license.
Attribution:
- You are free:
- to share – to copy, distribute and transmit the work
- to remix – to adapt the work
- Under the following conditions:
- attribution – You must give appropriate credit, provide a link to the license, and indicate if changes were made. You may do so in any reasonable manner, but not in any way that suggests the licensor endorses you or your use.
- share alike – If you remix, transform, or build upon the material, you must distribute your contributions under the same or compatible license as the original.
Source code
This media was created with Perl (interpreted programming language first released in 1987)
Here is a listing of the source used to create this file.
Here is a listing of the source used to create this file.
#!/usr/bin/perl -w

use strict;
use Math::Random;

my %shiftSchedule = (
    "first" =>  { "start" => 6.00, "end" => 14.00 },
    "second" => { "start" => 14.00, "end" => 22.00 },
    "third" =>  { "start" => 22.00, "end" =>  6.00 }
);
my $shift = "third";         # shift to monitor
my $inspectionRate = 1 / 2;  # every 1/2 hour
my $drift = 1.5;             # drift to simulate
my $m = 25;                  # samples in control chart setup
my $n = 12;                  # observations per sample
my $target = 100.0;          # quality characteristic target

my $hour;
my $i;
my $j;
my $minute;
my $observation;
my $setupM = $m;

#
# simulate control chart setup
#
open(SETUPCSV, ">xs_setup.csv") || die "! can't open \"xs_setup.csv\" ($!)\n";
for ($i = 1; $i <= $m; $i++) {
    for ($j = 0; $j < $n; $j++) {
        $observation = $target + random_normal();
		if ($j > 0) {
			print SETUPCSV ",";
		}
        printf SETUPCSV "%7.3f", $observation;
    }
	printf SETUPCSV "\r\n";
}
close(SETUPCSV);

#
# simulate control chart monitoring
#
open(MONITORINGCSV, ">xs_monitoring.csv") || die "! can't open \"xs_monitoring.csv\" ($!)\n";
$m = $shiftSchedule{$shift}{"end"} - $shiftSchedule{$shift}{"start"};
if ($m < 0) {
    $m += 24;
}
$m /= $inspectionRate;
for ($i = 1; $i <= $m; $i++) {
    $hour = int($i * $inspectionRate + $shiftSchedule{$shift}{"start"});
    if ($hour >= 24) {
        $hour -= 24;
    }
    $minute = ($i & 0x1) ? (60 * $inspectionRate) : 0;
    printf MONITORINGCSV "'%d:%02d'", $hour, $minute;
    for ($j = 0; $j < $n; $j++) {
        $observation = $target + random_normal();
        if ($i >= (0.25 * $m)) {
            if ($i < (0.75 * $m)) {
                $observation += ($drift / (0.5 * $m)) * ($i - (0.25 * $m));
            } else {
                $observation += $drift;
            }
        }
        printf MONITORINGCSV ",%7.3f", $observation;
    }
	printf MONITORINGCSV "\r\n";
}
close(MONITORINGCSV);
Source code
This media was created with MATLAB (numerical computing environment)
Here is a listing of the source used to create this file.
Here is a listing of the source used to create this file.
%
% display an s control chart in MATLAB
%
clear

%
% Phase I
%
% compute the control chart center line and control limits based on a
% process that is simulated to be in a state of statistical control
%
setupobservations = csvread('xs_setup.csv');
setupstats = controlchart(setupobservations, 'charttype', 's');

%
% Phase II
%
% read in the process observations representing the monitoring phase
%
observations = importdata('xs_monitoring.csv');

%
% first column is the time of the observation (24 hour clock)
%
halfhourlylabel = observations.rowheaders;

%
% second column consists of the observations (counts of
% nonconformances per rational subgroup)
%
monitoringobservations = observations.data;

%
% just display labels on the "on the hour" ticks
%
emptylabel = cell(size(monitoringobservations,1) - size(halfhourlylabel,1), 1);
emptylabel(:) = {''};
hourlylabel = vertcat(halfhourlylabel(2:2:end), emptylabel);

%
% plot the control chart for the monitoring phase observations
%
monitoringstats = controlchart(monitoringobservations, ...
							   'charttype', 's', ...
							   'label', halfhourlylabel.', ...
							   'mean', setupstats.mu, ...
							   'sigma', setupstats.sigma);
title('s chart for quality characteristic XXX')
xlabel('Sample')
ylabel('Standard deviation (units)')
%
% the labels supplied to controlchart() only appear when the user
% selects a plotted point with her mouse--we have to explicitly
% set labels in the X axis if we want them
%
set(gca,'XTickLabel', hourlylabel)

|
This image could be re-created using vector graphics as a SVG file. This has several advantages; see Commons:Media for cleanup for more information. If a SVG form of this image is available, please upload it and afterwards replace this template with
{{vector version available|new image name}}.It is recommended to name the SVG file “MATLABSChartForPairedXBarAndSChart.svg”—then the template Vector version available (or Vva) does not need the new image name parameter. |
Category:CC-BY-SA-3.0
Category:Control charts created with MATLAB
Category:Created also with Perl
Category:Images with MATLAB source code
Category:Images with Perl source code
Category:Other images that should use vector graphics
Category:PNG created with MATLAB
Category:PNG that should use vector graphics
Category:Self-published work