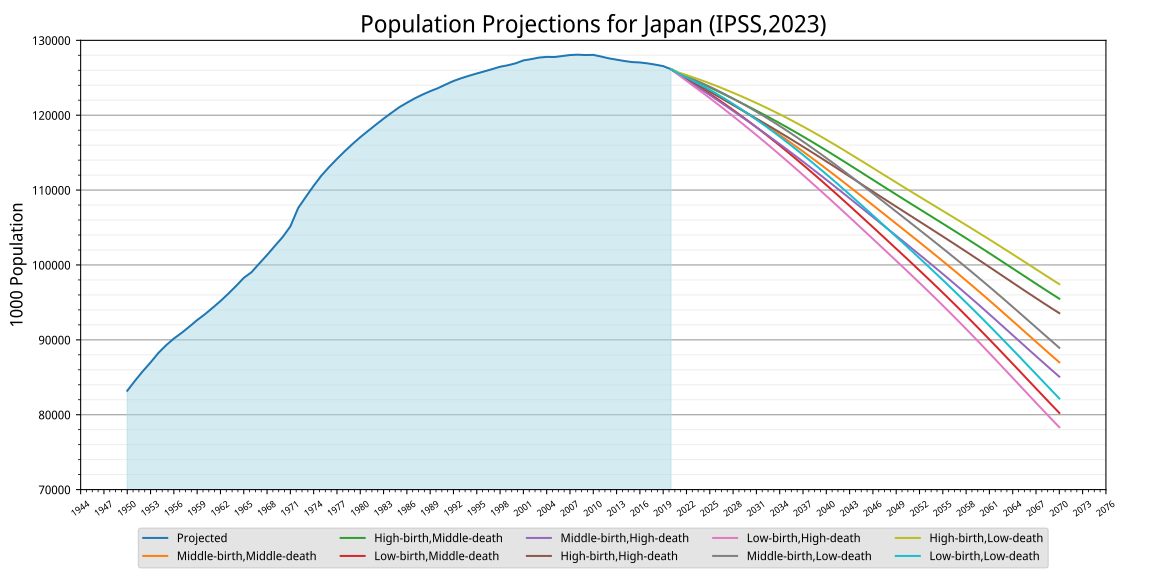
File:Population Projections for Japan.svg
| Uploaded by | Yuasan |
|---|---|
| Upload date | 2023-04-30T03:24:29Z |
| MIME type | image/svg+xml |
| Dimensions | 1080 × 540 px |
| File size | 133.3 KB |

|
This file may be updated to reflect new information. If you wish to use a specific version of the file without it being overwritten, please upload the required version as a separate file. |
Summary
| Description |
English: Population Projections for Japan (IPSS, 2023) |
| Date | |
| Source | Own work |
| Author |
Yuasan, Data from National Institute of Population and Social Security Research (IPSS) |
| Permission (Reusing this file) |
CC-0 |
Licensing
I, the copyright holder of this work, hereby publish it under the following license:
 
|
This file is made available under the Creative Commons CC0 1.0 Universal Public Domain Dedication. |
| The person who associated a work with this deed has dedicated the work to the public domain by waiving all of their rights to the work worldwide under copyright law, including all related and neighboring rights, to the extent allowed by law. You can copy, modify, distribute and perform the work, even for commercial purposes, all without asking permission.
|
graph data
import matplotlib.pyplot as plt
from cycler import cycler
import pandas as pd
import matplotlib.ticker as ticker

df1 = pd.read_csv("real.tsv", index_col=0 ,sep = "\t")
df2 = pd.read_csv("data.tsv", index_col=0 ,sep = "\t")

df = pd.merge(df1, df2, on='year', how='outer')

fig, ax = plt.subplots(figsize=(12, 6))
plt.rcParams['font.family'] = 'sans-serif'
plt.rcParams['font.sans-serif'] = ['Noto Sans Display']

plt.subplots_adjust(left=0.07, bottom=0.15, right=0.96, top=0.93)

ax.set_prop_cycle( plt.rcParams['axes.prop_cycle'])

ax.plot(df)
ax.fill_between( df.index ,0, df["Projected"].values,  color="lightblue", alpha=0.5)

ax.legend(df.columns, fontsize=9, ncol=5, loc='center' ,bbox_to_anchor=(0, -0.25, 1, 0.24) ,frameon=True, facecolor="#dddddd")
ax.set_axisbelow(True)

plt.ylim([70000,130000])

plt.title("Population Projections for Japan (IPSS,2023)", fontsize=18)
plt.tick_params(labelsize=9, pad=4)
plt.ylabel("1000 Population", fontsize=13)
plt.xticks(rotation=35, fontsize=7)
plt.yticks(fontsize=9)

ax.xaxis.set_major_locator(ticker.MultipleLocator(3))

plt.minorticks_on()
plt.grid(which='major',color='#999999',linestyle='-', axis="y")
plt.grid(which='minor',color='#eeeeee',linestyle='-', axis="y")

plt.savefig("image.svg")
 Any autoconfirmed user can overwrite this file from the same source. Please ensure that overwrites comply with the guideline.