File:Tail Function Graph.pdf
| Uploaded by | Inductiveload |
|---|---|
| Upload date | 2009-05-09T07:41:05Z |
| MIME type | application/pdf |
| Dimensions | 1239 × 1752 px |
| File size | 61.1 KB |
| Description |
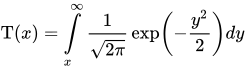
English: A graph of the Gaussian Tail function (the area under the normal distribution between x and +∞. This is given by:
|
||
| Date | |||
| Source | Own work | ||
| Author | Inductiveload | ||
| Permission (Reusing this file) |
|