File:BetaDistrMean.svg
| Uploaded by | Shiyu Ji |
|---|---|
| Upload date | 2017-10-08T05:57:16Z |
| MIME type | image/svg+xml |
| Dimensions | 720 × 540 px |
| File size | 1.9 MB |
Summary
| Description |
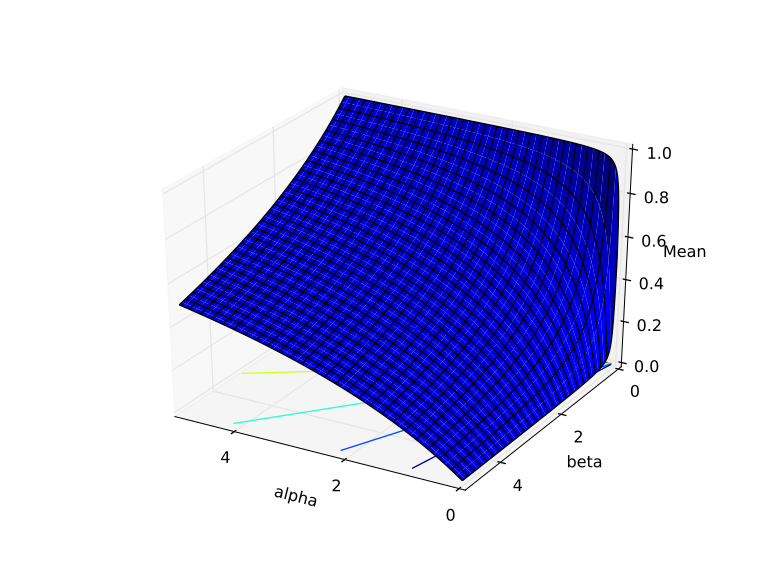
English: Mean Beta Distribution for alpha and beta from 0 to 5. |
|||
| Date | ||||
| Source | Own work | |||
| Author | Shiyu Ji | |||
| Other versions |
|
|||
| SVG development |  This plot was created with Matplotlib. This plot was created with Matplotlib. |


Python Source Code
# Beta distribution mean when alpha, beta in [0, 5].
# Idea from Dr. J. Rodal
# Use Inkscape to enlarge and adjust the figure position
# (degroup, enlarge and regroup the SVG elements etc.).

from mpl_toolkits.mplot3d import axes3d
import matplotlib.pyplot as pl
from matplotlib import cm
import numpy as np
from scipy.special import betainc
import scipy.integrate as integral

# Prepare the data by the mean
A = np.arange(0.01, 5.0, .01)
B = np.arange(0.01, 5.0, .01)
gridA, gridB = np.meshgrid(A, B)
Z = np.ndarray(shape=gridA.shape, dtype = float)
for i in range(len(A)):
  for j in range(len(B)):
    Z[j][i] = A[i] / (A[i] + B[j])
# Draw the data
fig = pl.figure()
ax = fig.add_subplot(111, projection = '3d')
pl.xticks([0.0, 2.0, 4.0])
pl.yticks([0.0, 2.0, 4.0])
ax.contour(gridA, gridB, Z, zdir='z', offset=0)
ax.plot_surface(gridA, gridB, Z, lw = 0.0)
ax.plot_wireframe(gridA, gridB, Z, lw = 1.0, color = 'black', \
   rstride=20, cstride=20)
ax.set_xlim([0.0, 5.0])
ax.set_ylim([0.0, 5.0])
ax.set_zlim([0, 1.0])
ax.set_xlabel('alpha')
ax.set_ylabel('beta')
ax.set_zlabel('Mean')
ax.view_init(30,120)
fig.savefig('betaDistrMean.svg')
Licensing
Shiyu Ji, the copyright holder of this work, hereby publishes it under the following license:


This file is licensed under the Creative Commons Attribution-Share Alike 4.0 International license.
Attribution:
- You are free:
- to share – to copy, distribute and transmit the work
- to remix – to adapt the work
- Under the following conditions:
- attribution – You must give appropriate credit, provide a link to the license, and indicate if changes were made. You may do so in any reasonable manner, but not in any way that suggests the licensor endorses you or your use.
- share alike – If you remix, transform, or build upon the material, you must distribute your contributions under the same or compatible license as the original.