File:PcaIdea.png

Uploaded by Sigbert
Upload date 2009-10-30T14:28:24Z
MIME type image/png
Dimensions 700 × 700 px
File size 4.5 KB

Summary

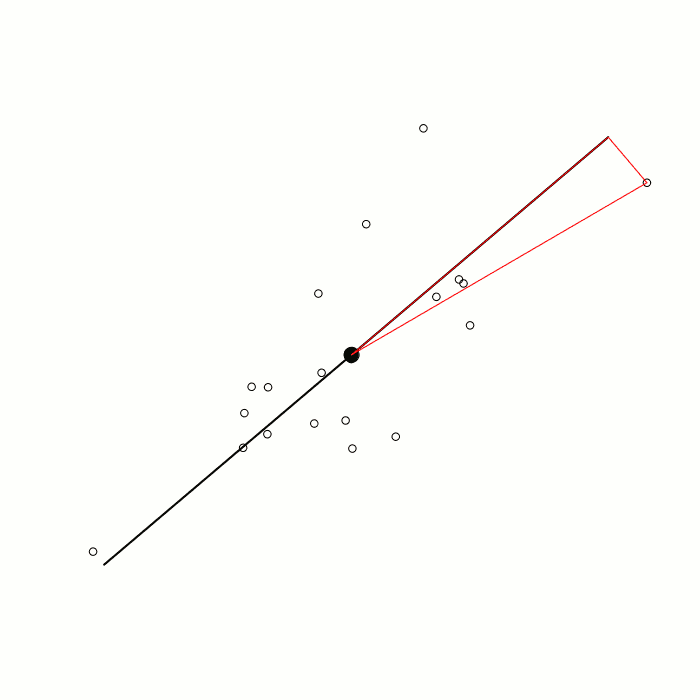
Description Visualize the idea of principal component analysis
Date
Source Own work
Author Sigbert (talk) 14:28, 30 October 2009 (UTC)
library(mvtnorm)
library(MASS)
set.seed(09101964)
s   <- matrix(c(1, 0.8, 0.8, 1), nr=2)
x   <- rmvnorm(20, sigma=s)
x   <- sweep(x, 2, apply(x, 2, mean))
d   <- sqrt(x[,1]*x[,1]+x[,2]*x[,2])
pos <- which.max(d)
d   <- max(d)
pca <- princomp(x)
eqscplot(x, axes=F)
mx  <- apply(x, 2, mean)
points(x=mx[1], y=mx[2], pch=19, cex=2)
psi <- min(pca$scores[,1])
psa <- max(pca$scores[,1])
p1  <- pca$loadings[,1]*psi
p2  <- pca$loadings[,1]*psa
pc1 <- matrix(c(p1,p2), nc=2, byrow=T)
lines(pc1, col="black", lwd=2)
if (-psi>psa) p3 <- p1 else p3 <- p2
lines(x=c(mx[1],p3[1], x[pos,1], mx[1]),y=c(mx[2], p3[2], x[pos,2], mx[2]), col="red", lwd=1)
 This chart was created with R.

Licensing

Public domain I, the copyright holder of this work, release this work into the public domain. This applies worldwide.
In some countries this may not be legally possible; if so:
I grant anyone the right to use this work for any purpose, without any conditions, unless such conditions are required by law.

Captions

Add a one-line explanation of what this file represents
Items portrayed in this file

depicts

30 October 2009

4,561 byte

700 pixel

700 pixel

image/png

a4b566a047686ebfccc302ac9029f1ffd3482acd

Category:Mathematical diagrams Category:PD-self Category:PNG created with R Category:Plots Category:Self-published work Category:Statistics Category:XY plots