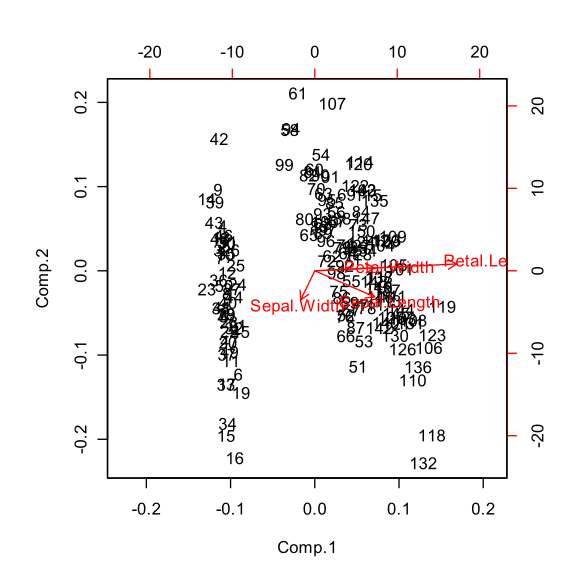
File:Biplot of Anderson's Iris data set.svg
| Uploaded by | Mdd |
|---|---|
| Upload date | 2008-10-14T21:18:22Z |
| MIME type | image/svg+xml |
| Dimensions | 540 × 540 px |
| File size | 83.9 KB |
Summary
| Description | Biplot of the Principal components analysis of Anderson's Iris data set. The SVG was created with R's biplot function using the CairoSVG device of the Cairo R package |
| Date | |
| Source | I created this work entirely by myself. |
| Author | Calimo |
| SVG development | |
| Source code | R codelibrary(Cairo)
CairoSVG("Biplot_of_Anderson's_Iris_data_set.svg")
biplot(princomp(iris[,1:4], scale=TRUE))
dev.off()
|


Licensing

|
I, the copyright holder of this work, release this work into the public domain. This applies worldwide. In some countries this may not be legally possible; if so: I grant anyone the right to use this work for any purpose, without any conditions, unless such conditions are required by law. |
References
- Gabriel, K.R., 1971. The biplot graphic display of matrices with application to principal component analysis. Biometrika 58 (3), 453-467.