File:Isostatic equilibrium EN.svg
| Uploaded by | Woudloper |
|---|---|
| Upload date | 2009-04-19T21:57:21Z |
| MIME type | image/svg+xml |
| Dimensions | 1900 × 1000 px |
| File size | 86.8 KB |
Summary
| Description |
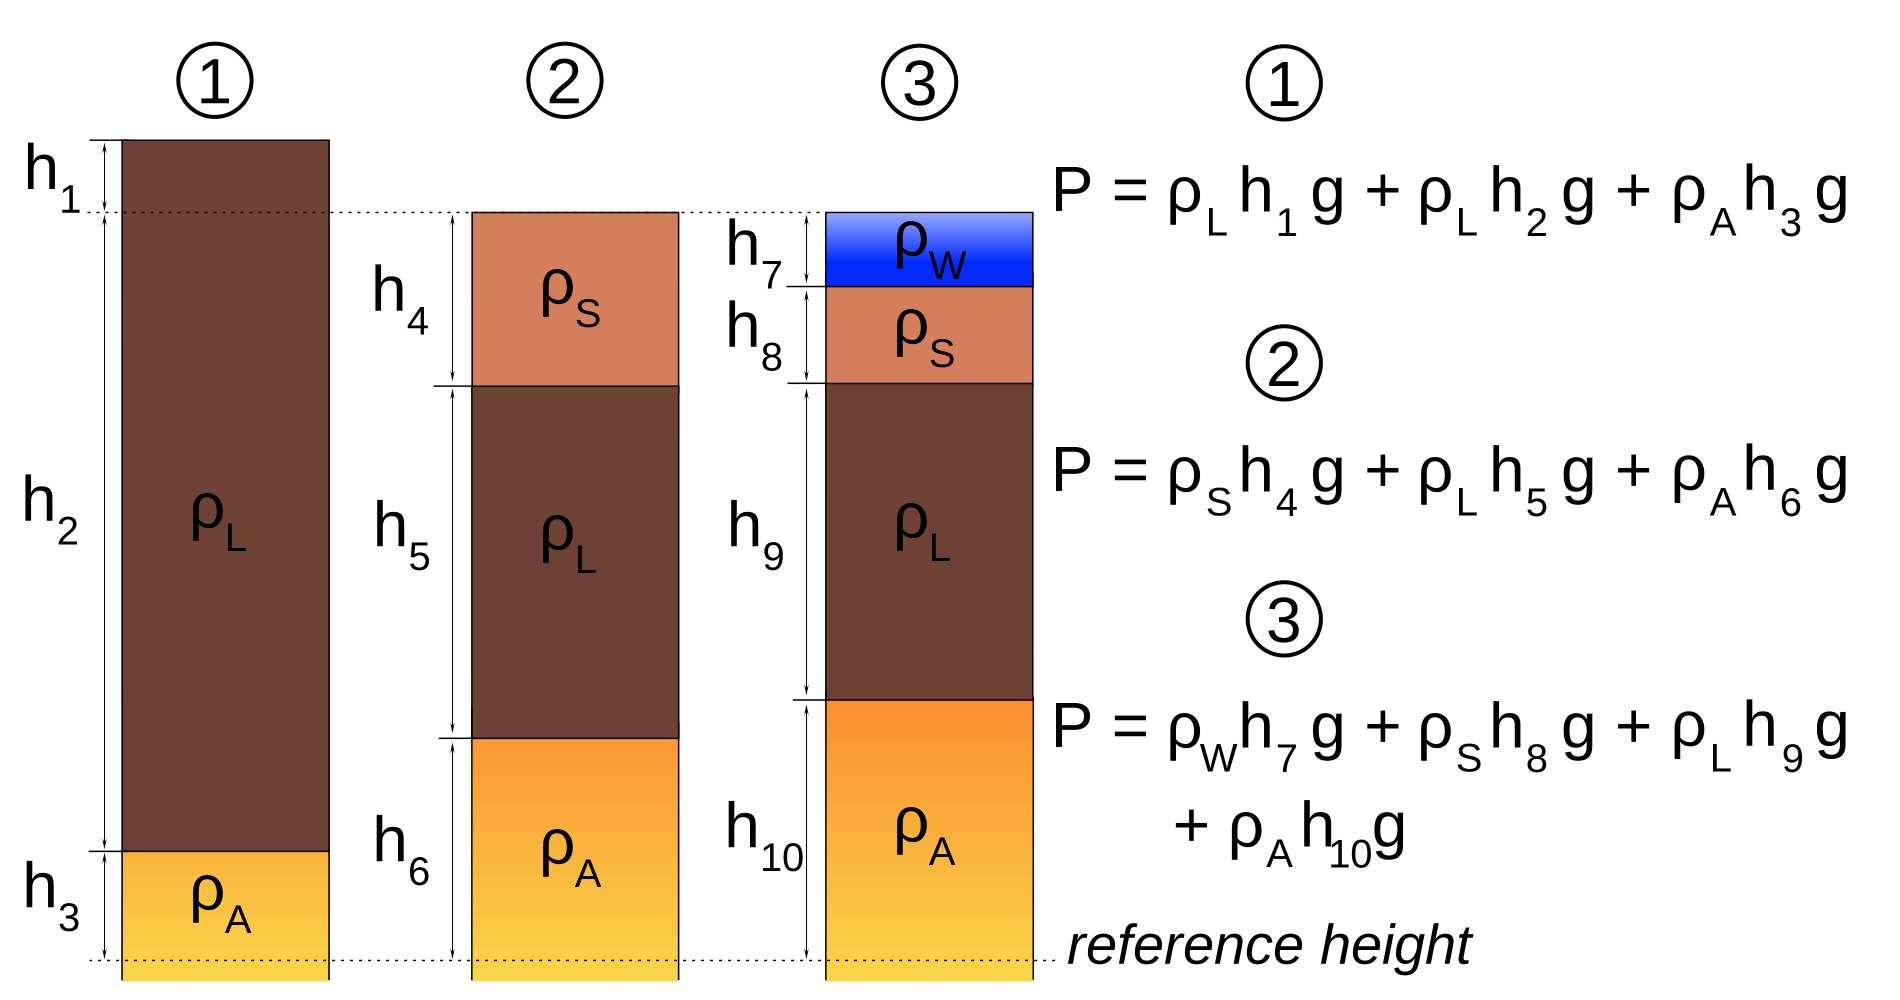
English: Schematic representation of the principle of isostatic equilibrium in geodynamics. The three situations in the figure are 1: a mountain range or plateau; 2: a totally filled basin (surface is at sea level); 3 an underfilled basin (with sea water forming the top part of the column). The formulas to the right give the lithostatic pressure at reference height. Symbols used: ρL = density of the lithosphere; ρA = density of the asthenosphere; ρS = density of the sediments in the basin; ρW = density of sea water. The heights of different sections of the columns are represented by a letter h; while g is the gravitational acceleration.
In the case of isostatic equilibrium, the (lithostatic) pressure should be equal for all three cases at the reference height, in formula: P1 = P2 = P3. |
| Date | |
| Source | Own work |
| Author | Woudloper |
| Other versions |
Dutch language version |

Licensing

|
I, the copyright holder of this work, release this work into the public domain. This applies worldwide. In some countries this may not be legally possible; if so: I grant anyone the right to use this work for any purpose, without any conditions, unless such conditions are required by law. |